In working with ultralarge chemical spaces, it is often useful for drug designers and other scientists like medicinal chemists to visualize the chemical decompositions of molecules, with a view towards understanding the local chemical space and the relationships between molecules.
In this post, I’ll cover a few different ways to do this which are appropriate for different settings. The overall context is that we have computed a decomposition of a molecule into a set of structure fragments. The molecule itself is represented by these fragments and the reaction rules to reconstitute them back together.
Highlighting the origin of individual atoms
It’s useful to be able to manipulate atom-level visualizations of these fragment decompositions. For each atom, we’d like to be able to track which fragment it came from.
This is an extra bit of bookkeeping that can be done when evaluating the infix expression corresponding to each structure. To do this, we modify and refactor the evaluate_expression function to return a parallel list of mol objects with annotated atoms:
CODE
from collections import defaultdictimport matplotlib.colorsfrom PIL import ImageRDLogger.DisableLog('rdApp.*') # keep the output tidy# --------------------------------------------------------------------# 1. two toy fragments (F0 and F1)# --------------------------------------------------------------------frags = ["[CH3:1]", # F0 : a methyl radical (map #1)"[CH3:2]", # F1 : another methyl radical (map #2)]# --------------------------------------------------------------------# 2. one reaction (R1) : CH3• + CH3• --> CH3–CH3 (ethane)# SMARTS with atom‑maps so provenance survives even on old RDKit# --------------------------------------------------------------------rxn_smarts = {"R1": "[CH3:1].[CH3:2]>>[CH3:1]-[CH3:2]"}from rdkit import Chem, RDLoggerfrom rdkit.Chem import AllChem, Drawfrom rdkit.Chem.Draw import rdMolDraw2Dfrom IPython.display import SVG, displayimport matplotlib.pyplot as plt, numpy as npRDLogger.DisableLog('rdApp.*') # keep the output tidydef _propagate_frag_ids(prod, reactants): p = Chem.Mol(prod)for at in p.GetAtoms(): ids =set()if at.HasProp("react_idx") and at.HasProp("react_atom_idx"): r =int(at.GetProp("react_idx")) a =int(at.GetProp("react_atom_idx")) ra = reactants[r].GetAtomWithIdx(a)if ra.HasProp("frag_id"): ids.update(ra.GetProp("frag_id").split(","))elif at.HasProp("old_mapno"): m =int(at.GetProp("old_mapno"))for rm in reactants:for ra in rm.GetAtoms():if ra.GetAtomMapNum() == m and ra.HasProp("frag_id"): ids.update(ra.GetProp("frag_id").split(","))ifnot ids: ids.add("NEW") at.SetProp("frag_id", ",".join(sorted(ids))) at.SetAtomMapNum(0)return pdef evaluate_expression(expr, frags_program, rxn_dict): tok = expr.split('_')iflen(tok) ==1and tok[0].startswith('F'): idx =int(tok[0][1:]) mol = Chem.MolFromSmiles(frags_program[idx])for a in mol.GetAtoms(): a.SetProp("frag_id", f"F{idx}")return [Chem.CanonSmiles(frags_program[idx])], [mol]# assume F# _ R# _ F# (binary) left, rcode, right = tok l_smi, l_mol = evaluate_expression(left, frags_program, rxn_dict) r_smi, r_mol = evaluate_expression(right, frags_program, rxn_dict) rxn = AllChem.ReactionFromSmarts(rxn_dict[rcode]) products, annotated = [], []for lm in l_mol:for rm in r_mol:for prods in rxn.RunReactants((lm, rm)): prod = prods[0] smi = Chem.CanonSmiles(Chem.MolToSmiles(prod, True))if smi in products:continue products.append(smi) annotated.append(_propagate_frag_ids(prod, (lm, rm)))return products, annotated# --------------------------------------------------------------------# 4. Cookbook‑style highlighter (multiple colours)# --------------------------------------------------------------------def _avg_rgb(cols):returntuple(float(np.mean([c[i] for c in cols])) for i inrange(3))def highlight_fragments(mol, size=(300,200), palette=["#bdbdbd", '#e6194b', '#3cb44b', '#ffe119', '#4363d8', '#f58231', '#911eb4', '#46f0f0', '#f032e6', '#bcf60c', '#fabebe', '#008080', '#e6beff', '#9a6324', '#fffac8', '#800000', '#aaffc3', '#808000', '#ffd8b1', '#000075', '#808080', '#7d87b9', '#bec1d4', '#d6bcc0']): athighlights = defaultdict(list) arads = {} uq_fids =set()for a in mol.GetAtoms():for fid in a.GetProp("frag_id").split(","): uq_fids.add(fid) athighlights[a.GetIdx()].append( matplotlib.colors.to_rgb(palette[int(fid[1:])]) ) arads[a.GetIdx()] =0.5 bndhighlights = defaultdict(list)for b in mol.GetBonds():for fid in uq_fids:if fid in athighlights[b.GetBeginAtomIdx()] and fid in athighlights[b.GetEndAtomIdx()]: bndhighlights[b.GetIdx()].append( matplotlib.colors.to_rgb(palette[int(fid[1:])]) ) d = rdMolDraw2D.MolDraw2DSVG(*size) d = rdMolDraw2D.MolDraw2DCairo(*size)# rdMolDraw2D.PrepareAndDrawMolecule(# d, mol,# highlightAtoms=list(a_cols),# highlightAtomColors=a_cols,# highlightBonds=list(b_cols),# highlightBondColors=b_cols,# ) d.DrawMoleculeWithHighlights( mol, "", dict(athighlights),dict(bndhighlights),arads,{} ) d.FinishDrawing() img = Image.open(io.BytesIO(d.GetDrawingText())) display(img)#display(SVG(d.GetDrawingText()))expr ="F0_R1_F1"smis, mols = evaluate_expression(expr, frags, rxn_smarts)print("canonical SMILES:", smis[0])for a in mols[0].GetAtoms():print(f"Atom {a.GetIdx():>2}: frag_id = {a.GetProp('frag_id')}")highlight_fragments(mols[0])
canonical SMILES: CC
Atom  0: frag_id = F0
Atom  1: frag_id = F1
With more complicated structures, this really does delineate the fragment-based decomposition of any chemical structure.
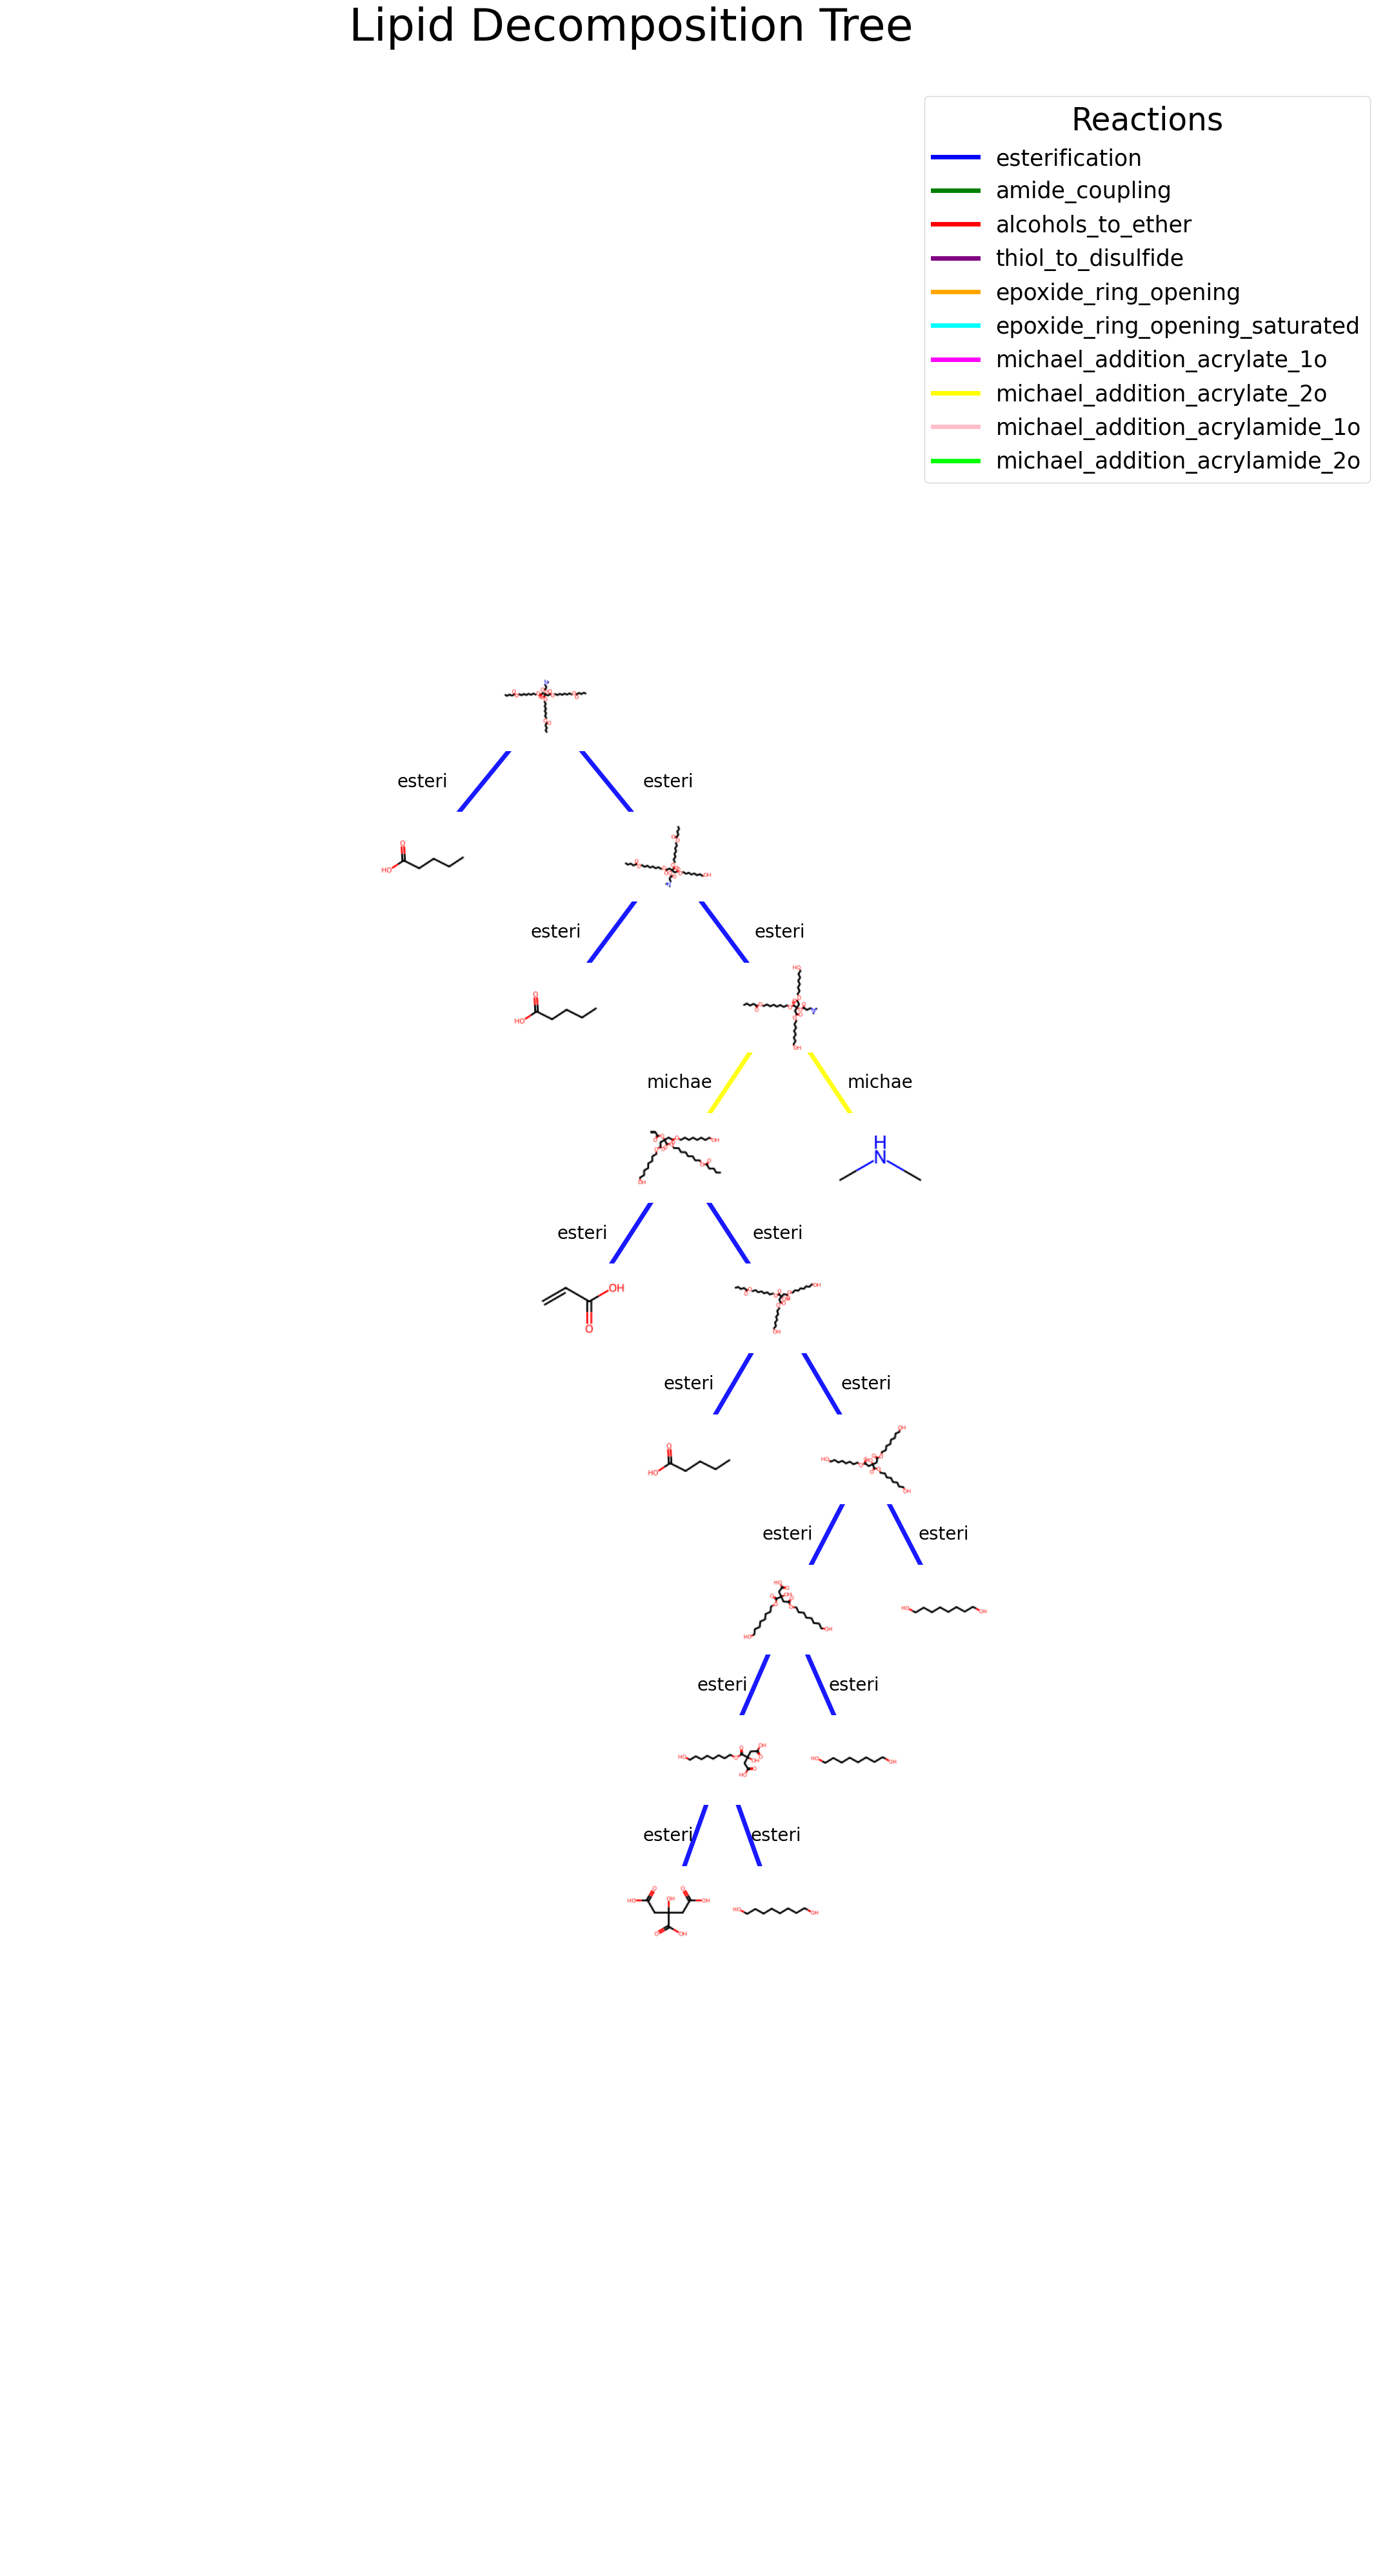
Tree-based images
A complementary way to proceed is to render fragments individually and use the inherent tree-based structure of the decomposition as a guide to visualization.
CODE
# Importsfrom datetime import datetimeimport numpy as npimport networkx as nxfrom networkx.drawing.nx_pydot import graphviz_layoutfrom networkx.readwrite import json_graphfrom rdkit import Chemfrom rdkit.Chem import Drawimport matplotlib.pyplot as pltimport matplotlib.lines as mlinesfrom matplotlib.offsetbox import OffsetImage, AnnotationBboxfrom PIL import Imageprint('Last modified:', datetime.now())
Last modified: 2025-06-14 19:47:30.508200
Style config
We want to color each reaction differently to better illustrate the skeleton of the molecule.
class TreeNode:def__init__(self, label):self.label = labelself.children = []def construct_tree(molecule_info, root_smiles): root = TreeNode(root_smiles)def build_tree(node, smiles):if smiles in molecule_info: reaction_type = molecule_info[smiles]['reaction_type']for component_smiles in molecule_info[smiles]['components']: child_node = TreeNode(component_smiles) node.children.append((reaction_type, child_node)) build_tree(child_node, component_smiles) build_tree(root, root_smiles)return rootdef get_tree(input_molecule_smiles): input_molecule_smiles = Chem.CanonSmiles((input_molecule_smiles)) molecule_info, _, _, _ = ccd_tools.decompose_dataset( [input_molecule_smiles], rxn_smarts_dict, rxn_codes, reaction_types=["esterification"], print_debug=False ) db_construction.decompose_lipid_set( [input_molecule_smiles], default_pfx ='all_chems/' ) root_node = construct_tree(molecule_info, input_molecule_smiles) nodes = [] links = [] index =0# Recursive function to traverse the tree and populate nodes and linksdef traverse_tree(node, index):# Add the current node to the list of nodes ind = index nodes.append({"name": f"{node.label}_{ind}"}) # Adding index to ensure unique node namefor reaction_type, child_node in node.children: links.append({"source": f"{node.label}_{ind}", "target": f"{child_node.label}_{ind+1}", "name": reaction_type})# Recursively traverse child nodes traverse_tree(child_node, index+1) traverse_tree(root_node, index) G = nx.DiGraph()# Replace all white pixels with background colorfor node in nodes: G.add_node(node["name"])for link in links: G.add_edge(link["source"], link["target"], **link) data = json_graph.tree_data(G, root=input_molecule_smiles+'_0') T = nx.tree_graph(data)for node in G.nodes: T.add_node(node)for link in links: T.add_edge(link["source"], link["target"], **link)return T,nodes,links
Tree display function
CODE
def display_lipid_tree(input_molecule_smiles): input_molecule_smiles = Chem.CanonSmiles(input_molecule_smiles) T, nodes, links = get_tree(input_molecule_smiles) pos = graphviz_layout(T, prog="dot") # Nodes coordinates fig, ax = plt.subplots(figsize=(25, 50)) ax.set_aspect('auto') ax.set_zorder(1) # Set zorder of edges to 1 ax.set_facecolor('#%02x%02x%02x'% bg_col) cmap = plt.get_cmap("viridis") xmin, xmax, ymin, ymax =0, 0, 0, 0for e in links: node1, node2, reaction = e["source"], e["target"], e["name"] x1, y1 = pos[node1] x2, y2 = pos[node2] xmin =min(xmin, x1, x2) xmax =max(xmax, x1, x2) ymin =min(ymin, y1, y2) ymax =max(ymax, y1, y2) line = plt.Line2D((x1, x2), (y1, y2), linewidth=5, alpha=0.9, color=reaction_colors[e['name']]) ax.add_line(line) text_x = x2 text_y = (y1 + y2) /2 ax.text(text_x, text_y, reaction[0:6], fontsize=20, ha='center', va='center', color='black')for i, smiles inenumerate(T.nodes()): smiles = smiles.split('_')[0] mol = Chem.MolFromSmiles(smiles)if mol isnotNone: img = Draw.MolToImage(mol, size=(100, 100)) img = np.array(img) img[np.all(img ==255, axis=-1)] = bg_col # Replace all white pixels with background color img = Image.fromarray(img)# Create image annotation box and add to plot imagebox = OffsetImage(img) ab = AnnotationBbox(imagebox, pos[list(T.nodes.keys())[i]], frameon=False, pad=0.0, bboxprops=dict(edgecolor='none')) ab.set_zorder(2) # Set zorder of nodes to 2 ax.add_artist(ab) ax.axis('off') ax.set_title('Tree-based chemical decomposition', fontsize=50, pad=50) legend_handles = []for reaction, color in reaction_colors.items(): legend_handles.append(mlines.Line2D([], [], color=color, label=reaction, linewidth=5)) legend = ax.legend(handles=legend_handles, title='Reactions', fontsize=25, title_fontsize=35, loc='upper right', bbox_to_anchor=(1.1, 1)) legend.set_zorder(3) # Set zorder of legend to 3 sm = plt.cm.ScalarMappable(cmap=cmap, norm=plt.Normalize(vmin=0, vmax=70))xrange= xmax-xmin yrange = ymax-ymin ax.set_xlim([xmin-xrange/2, xmax+xrange/2]) ax.set_ylim([ymin-yrange/2, ymax+yrange/2]) bg_col_normalized =tuple(value /255for value in bg_col) fig.patch.set_facecolor(bg_col_normalized) plt.show()